
Hyderabad, Sept. 27 (Maxim News):Plight of Muslims in Telangana | All India Majlis-E-Ittehadul Muslimeen held a discussion on “Muslims in Telangana Poverty and other challenges here on Monday.
The Event was held to sensitse Muslims about their plight and to put pressure on Telangana Government to extend Dalith Bandhu like scheme to Muslims also.
Muslims currently constitute about 12.8% of the population of the State of Telengana. The community lag for behind other socio-religious categories (SRCs) in educational, economic, employment, housing, access to credit and other development indicators. The paper advocates timely and strategic developmental interventions to arrest the constant worsening of relative development situation of the community. In this regard, it argues for extending the benefits of Dalit BandhuYojna to 1% of the Muslim living in abject poverty in the State.
LIVE: Asad Owaisi participating in a discussion on Muslims in Telangana | IND TODAY | 27-09-2021 watch at
In one of the most pluralistic societies of the world, the second-largest religious group in the country is languishing in impoverishment and underdevelopment. Socio-economic backwardness and educational deprivation have accelerated the developmental marginalisation of the Muslim community. Muslims face multiple levels of deprivation, akin to historically marginalised groups of the country. The community, however, is not privileged to statutory protections against discrimination and socio-economic exclusion. The lack of political mobilisation and credible leadership has made Muslims a victim of political appeasement. The current wave of intolerance, the surge in Islamophobia and inherent prejudices have created deep-seated insecurities among the members of the community.
Plight of Muslims In Telangana
Muslims constitute about 12.8% of the total population of Telangana, which currently in absolute number isaround48 Lakh. Muslims in the State are backward ascompared to their Hindu counterparts. The share of Muslims in the poorest 20% of Telangana is rising, indicating a high risk of poverty for the group. Evidence-backed research reveals that Muslims fare poorly on most human development indicators.
The Muslim community in Telangana faces backwardness in education, income, and employment opportunities. They also lack access to formal credit channels, asset ownership and housing. While surviving in endemic poverty, they also deal with increasing burdens of discrimination and prejudices. The present paper makes an assessment of current situation of Muslims in the State in the above-mentioned development indicatonsincomparison to other socio-religious categories, and recommends policy measures to arrest the constant worsening of the developmental situation of the community.
Education: Literacy and Attendance Rate
The relative position of the Muslim community in educational attainment as worsened in the state since the independence. Today, they are no longer better off than any Hindu-BCs or SCs
and STs. There is not much difference between the above-mentioned communities in literacy rate and in school education, in terms of percentage of children in 5-15 years age-group attending schools. In fact, Muslims have a better literacy rate than the state average literacy rate. In 2011, the Muslim literacy rate in the State was 76.9% (7years and above age-group), while the total literacy rate of the State was 66.5% in the same year. However, as compared to other forward communities, the Muslim community does not have much advantage in the literacy rate. The literacy is measured as the ability of induvial in reading and writing (even able to write his/her name) with certain level of understanding. In fact, meaningful and prime indicators of educational development, therefore,are considered to beattainments of various levels of education. In this regard we find that Muslims far lag behind other communities in the State. Children from the Muslim community drastically drop out after the primary and middle level of education, and the gap between Muslims and other socio-religious categories widens in educational attainments. A drastic reduction in the percentage of children attending Higher Secondary School among the Muslim community indicates a very high dropout rate. It shows the transition from Matric to Higher Secondary level of schooling itself is a big hurdle. Although the percentage of Muslim children among the total enrolled in school education is above their share in the population, it is disproportionately very low at higher levels of education and in any professional courses, including medicine, pharmacy, engineering, polytechnic and others.
Further, the literacy rate, including in Sudheer Commission Report (2016) does not indicate functional literacy, which requires completion of a minimum of five years of formal schooling. Also, the literacy rate does not reflect on educational attainment or development across socio-religious communities. The Commission of Inquiry Report does not deny the fact that Muslims do not have many disadvantages in respect of literacy rate. However, the report brought forth the fact that Muslims have a disadvantage in formal education (schooling, college and higher education). In terms of educational attainment, Muslims, especially the backward classes, lag behind other SRCs.
Further, as compared to other SRCs, Muslims have higher dropout rates across different levels of education. Such a phenomenon indicates their educational backwardness. Therefore, the argument herein is that a higher literacy rate among Muslims is not reflecting their social and educational development and advantage in attending the formal education system (school or colleges).
Table-1: Percentage distribution (%) of persons (5-24 years age) across SRCs currently attending any educational institution in Telangana, 2016
| Age-Group | Hindu-SC | Hindu-ST | Hindu-OBC | Hindu-Others | All Hindus | Muslim-OBC | Muslim-Others | All-Muslims | Other Minorities | All |
| 1 | 2 | 3 | 4 | 5 | 6 | 7 | 8 | 9 | 10 | 11 |
| 5-10 Years | 100 | 100 | 99.8 | 100 | 99.9 | 98.8 | 98.9 | 98.8 | 99.6 | 99.2 |
| 11-15 Years | 95.7 | 94.7 | 96.3 | 98.9 | 96.3 | 90.6 | 89.8 | 90.4 | 96.1 | 92.7 |
| 16-20 Years | 67.4 | 49.4 | 63.9 | 81.6 | 65.2 | 48.1 | 50.1 | 48.5 | 68.9 | 55.8 |
| 21-24 Years | 26.1 | 16.4 | 25.7 | 25.8 | 25.2 | 18.6 | 18.4 | 18.6 | 31.4 | 22.2 |
| All | 76.2 | 67.8 | 76.2 | 80.9 | 76.1 | 69.9 | 71.0 | 70.1 | 78.1 | 72.8 |
Source: Table 3.7 on page 43 of Commission of Inquiry Report, 2016 – information based on its Sample Survey conducted by Centre for Good Governance.
Additionally, the relatively higher literacy among the Muslim community is also partly due to their short-time learning in Madrasas. Some of them have become literates by attending Madrasas at least for one or two years. They might have learned nothing more than reading the Quran and writing or making their signature (write their names), particularly in the Urdu language. The literacy skills acquired through this informal system of Madrasas are not equal to those basic or functional literacy skills required and may not be useful in the general parlance of everyday life. In this regard, one must keep in mind such differences between literates among Muslim and other communities. Therefore, as mentioned above, to understand the educational development, what needs to be compared is the educational levels attained by the communities – for instance,the percentage of the population educated above senior or higher secondary levels or graduate.
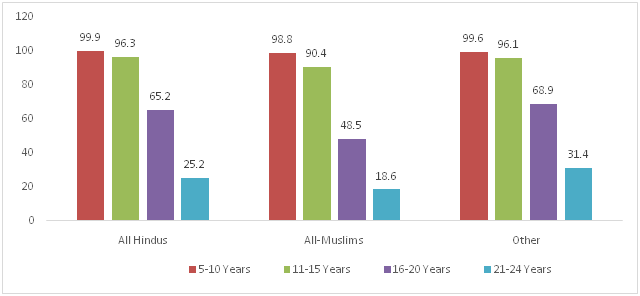
Figure 1 showsthat between the ages of 5-10, the proportion of students attending educational institutes by different religious groups is similar. Between the ages of 11-15 years, there is a decline among Muslim students attending educational institutes. However, the contrast is stark between ages 16-20 years, with only 48.5% of Muslims enrolled in education. The enrolment of Muslim students further falls to 18.6% in the age-group 20-24 years, while the same for all-Hindus and other religious communities remains relatively much higher.
Figure-1:Percentage distribution (%) of persons (5-24 years age) across SRCs currently attending any educational institution in Telangana, 2016
In terms of achievement in child schooling, particularly at the primary level, the percentage of children of 5-10 years age-group attending school appears to be a universalised school attendance across communities. Still, there are gaps.TheMuslim community lags behindascompared to other communities (see Table 1). In the next cohort, i.e. middle and lower secondary school-age children (11-15 years of age), there is a considerable gap in the percentage of children attending schools across communities. Muslims lag substantially in this also. Like the school attendance, they are lagging behind even the SC/STs in this regard. A very sharp inter-community difference with respect to the higher secondary and graduation age cohort, i.e. 16-20 years age group, exists in the State. The percentage of children/person attending schools or colleges among the Muslim community in general lags behind 28 per cent below that of SCs, 25 per cent below that of Hindu-OBCs and 40 per cent below that of Hindu-Others. The situation is almost the same for both the Muslim-OBCs and Muslim-Others. In the 21-24 years age cohort, the percentage attending any educational institution, the Muslim community falls behind 25 to 30 per cent than that of SC, Hindu-OBCs and Hindu-Others (see Table 1).
Table-2: Percentage of selected age group population with levels of educational attainment across SRCs in Urban Telangana, 2011-12
| Age-group & Level of Education | Hindu -SC | Hindu -ST | Hindu -OBC | Hindu-Others | All Hindus | Muslim-OBC | Muslim-Others | All-Muslims | Oth. Min. | All |
| 1 | 2 | 3 | 4 | 5 | 6 | 7 | 8 | 9 | 10 | 11 |
| 12Yrs+ & Primary+ | 72.8 | 67.4 | 75.9 | 92.3 | 78.8 | 60.6 | 77.7 | 73.5 | 78.5 | 77.5 |
| 15Yrs+& Elementary+ | 66.1 | 60.3 | 67.6 | 87.2 | 71.4 | 43.5 | 62.9 | 57.9 | 54.6 | 68.1 |
| 17Yrs+& Secondary+ | 50.9 | 42.9 | 58.3 | 81.9 | 61.8 | 31.7 | 53.2 | 47.3 | 44.6 | 58.4 |
| 19Yrs+&Higher Secondary+ | 34.1 | 30.4 | 42 | 67.8 | 46.1 | 14.6 | 34.9 | 29.2 | 33 | 42.2 |
Figure-2: Percentage of selected age group population with levels of educational attainment across SRCs in Urban Telangana, 2011-12
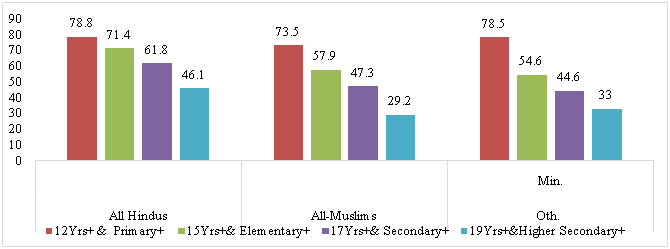
In terms of educational attainment (or completion rates), the percentage completed primary schooling among the 12 years and above age population, the achievement among the Muslim community, in general, is on par with the SC/STs and falling behind 3 per cent below Hindu-OBCs and 20 per cent below the Hindu-Others (Table 2). This discussion here is based on Table 2 refers to urban areas where three-fourths of the Muslim population of the State is concentrated. With respect to the percentage completed elementary schooling among the 15 years and above age population, the achievement among the Muslim community, in general, is falling behind 4 per cent below that of STs, 12 per cent below that of SCs, 14 per cent below that of Hindu-OBCs and 34 per cent below that of Hindu-Others. The Muslim community’s educational attainment deficit continues atthe secondary level, and the gaps are even wider. With respect to the percentage completed secondary schooling among the 17 years and above age population, the achievement among the Muslim community, in general, is on par with STs and falling behind 12 per cent below that of SCs, 19 per cent below that of Hindu-OBCs and 44 per cent below that of Hindu-Others. With respect to the percentage completed higher secondary schooling among the 19 years and above age population, the achievement among the Muslim community in general falls behind 4 per cent below that of STs, 14 per cent below that of SCs, 30 per cent below that of Hindu-OBCs and 60 per cent below that of Hindu-Others.
Health:
For some health-related indicators like children’s nutrition status, Muslims are not disadvantaged than any other socio-religious communities. But there are certain aspects of health indicators in which the Muslim community is lagging.
The prevalence of severe anaemia among Muslim female children and adolescents is comparatively higher. The percentage of Muslims adolescent men and women and pregnant women suffering from anaemia is high compared to Hindus and is more than the state average. The percentage of Muslim households who received Janani Suraksha Yojana is lower in rural and urban areas, particularly when compared to SCs and STs.
The percentage of the population availing public health care facilities is higher among the Muslim community. The majority of Muslim households surveyed prefer government facilities. While most of the Muslim population stays in urban areas of the State, the percentage of the urban Muslim population having health insurance is less in comparison to other SRCs. Nearly 84.4% of Muslim households in rural areas availed integrated child development services (ICDS) benefits, but it is much lowerthan that of the share of Hindu households availing the services.
Further,in the urban areas, the utilisation of ICDS services by Muslims is limited to a mere 53.5% which is 20 percentage points lesser than the utilisation by the Hindus.
Percentage households received JSY benefits is lower among the Muslim community, particularly in urban areas. It is lower than SC/ST and Hindu-OBCs. The percentage of households benefiting from JSY among the Muslim community in urban areas is 50 per cent lower than SCs, 10 per cent lower than STs, and 30 per cent lower than Hindu-OBCs. Percentage households having health insurance is lower among the Muslim community, particularly in urban areas. It is lower than SC/ST and Hindu-OBCs. The percentage of households having health insurance among the Muslim community in urban areas is 10 per cent lower than SC/STs and 14 per cent lower than that of Hindu-OBCs.
Housing Conditions:
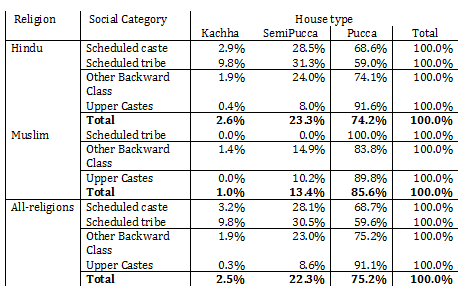
The Muslim community lags behind all the other SRCs in terms of ownership of houses. The situation is grim in the urban areas, where only 57.2% of the Muslim households own houses compared to 73.4% in Hindu Households. Despite the larger presence of Muslims in Urban areas, the extent of non-ownership and poor housing conditions of Muslims reflect their lower economic empowerment. The percentage of households having their own house is comparatively lower among the Muslim community, particularly those located in urban areas. In this regard, the Muslim community in urban areas falls behind around 25 per cent of the SC/STs and 21 per cent Hindu-OBCs and 15 per cent lower than Hindu-Others.
In terms of percentage of households living in Pucca houses, the Muslim community falls behind 14 per cent lower than SCs, 10 per cent lower than STs, 21 per cent lower than Hindu-OBCs and 38 per cent lower than that of Hindu-Others. This is higher in urban areas where a large chunk of the Muslim community is located. In terms of the percentage of households using clean fuels, the Muslim community is just on par with SC/STs but falls behind Hindu-OBCs and Hindu-Others. In rural areas Muslim community falls behind 20 per cent lower than Hindu-OBCs and 33 per cent lower than Hindu-others. In urban areas Muslim community falls behind 5 per cent lower than Hindu-OBCs and 17 per cent lower than Hindu-others.
Table-3: Living house type of families by religion in Telangana
Employment Conditions: Employment in Organised and Unorganised Sectors
The work participation rate (WPR) for both Muslim men and women is lower when compared to other SRCs. The work participation among Muslim women is very low. In most cases, it is even less than 1/3rd of the share of the WPR of other groups. The female work participation rate for Muslims is only 17.8% compared to 50.5% for Hindus, 31.7% for Other Minorities, and 46.2% for the State. Work participation for both Muslim OBC and others, for both males and females, is very low compared to other SRCs.
In rural areas, a comparatively smaller percentage of Muslim workers is engaged in agriculture. However, a higher percentage of Muslim female workers is in agriculture. For other SRCs, workers (both male and female) in rural areas are more in the agricultural sector.
In urban areas, all Muslim workers are engaged in non-agricultural activities. A higher percentage of Muslim workers is engaged as casual labour in the non-agricultural sector. When compared to other SRCs, it (for Muslims) is highest (26.5%), followed by SCs (23.1%) and STs (23.8%). A very low percentage of Muslims (4.2% self-employed in agriculture and 4.9% as casual labour in agriculture) are engaged in agricultural activities. This also shows the landlessness of the Muslim community. The percentage of unemployed among Muslims is higher when compared to other SRCs, except Hindu-Others.
A very low percentage of Muslim workers are in public sector employment, both in rural (1.8%) and urban (5.1%) areas. This is the lowest when compared to any other SRCs.
The percentage of Muslim-OBCs working in public sectors is 3.6%, it is lowest in urban areas, and only 0.1% Muslim-Others of rural areas works in the public sector. A higher percentage of Muslims are involved in business and trade (16.3%), followed by transport (13.2%) and then manufacturing (11.9%).
Most of those involved in transport are self-employed by running auto-rickshaw. Only 4.0% of Muslims are in government posts. The percentage is almost the same for both Muslim- BCs and Muslim-Others. This percentage is much lower than SC, ST, Hindu- other and other minorities.
The daily wage for Muslim women workers as casual labour is the lowest (Rs.100) when compared to other SRCs. In regular jobs, Muslim women get the second-lowest minimum daily wage (Rs.133) after ST women (Rs.96). The gap in wage rates between a regular job and causal labour is low among Muslim males. It is lowest for ST males (Rs.22), followed by Muslim-OBCs (Rs.53) and Muslim-others (Rs.83). The workforce engaged in non-agricultural activities and availing of social security benefits is lower among Muslims.
In terms of the work participation rates, the Muslim community is falling behind 32 per cent lower than SCs, 41 per cent lower than STs, 30 per cent lower than Hindu-OBCs and 14 per cent lower Hindu-Others. The severity of the phenomenon is higher in the case of Muslim females in the State. They have observed that a large proportion of the Muslim community is living in urban areas, and a majority of them are engaged in non-agricultural activities.
The percentage of the workforce engaged in casual labour in non-agricultural activities is higher among the Muslim community. It is 15 per cent higher than SCs, 11 per cent higher than STs, 41 per cent higher than Hindu-OBCs and more than 260 per cent higher than Hindu-Others.
The percentage of the workforce employed in the informal sector is also high among the Muslim community living in rural and urban areas. In this respect, the Muslim community in rural areas is on par with SCs but 26 per cent higher than STs, 8 per cent higher than Hindu-OBCs and 12 per cent higher than Hindu-Others. In urban areas, such a phenomenon is more severe: the Muslim community working in the informal sector is 22 per cent higher than SCs, 25 per cent higher than STs, 11 per cent higher than Hindu-OBCs and 25 per cent higher than Hindu-Others.
In terms of the differences in casual labour daily wages of males in the urban non-agricultural sector, the Muslim community’s average wage rate, especially the Muslim-OBC, is on par with SC/STs, Hindu-OBCs and Hindu-Others or above their averages. But the Muslim-Others fall behind 12 per cent lower than Hindu-OBCs. In terms of differences in regular wages of males in the urban non-agricultural sector, the Muslim community falls behind – where Muslim-OBCs have regular wages 10 per cent lower than that of SCs, 22 per cent lower than Hindu-OBCs and less than half of Hindu-Others. Similarly is the case of Muslim-Others.
Public Employment
Adequate representation of social groups in Public Employment is seen as an important factor in inculcating a sense of belonging to the communities by becoming part of governance. However, Muslims form only 7.4 per cent of the total employees of the Telangana Government, which is disproportionately low compared to their population share of 12.68 per cent. Department-wise break-up indicates that except five Secretariat departments such as Finance, Labour, Housing, Civil supplies, Agriculture and Cooperation, and the Heads of Departments under their control, all other departments have lower representation of the Muslim community.
The representation of Muslims in the top three Civil Services of IAS, IPS and IFS (Indian Forest Service) in Telangana is abysmally low, at 2.94 per cent of the total. It is observed that Muslims are under-represented in the Departments that have more dealings with the public where the number of employees is higher. This shows the marginalisation of the Muslim community in Public employment.
Economic Conditions
In respect of sources of livelihoods (income), the Muslim population is largely dependent on non-agricultural activities. Not only that, as a large portion of the Muslim population is located in urban areas, they are engaged in non-agricultural activities.
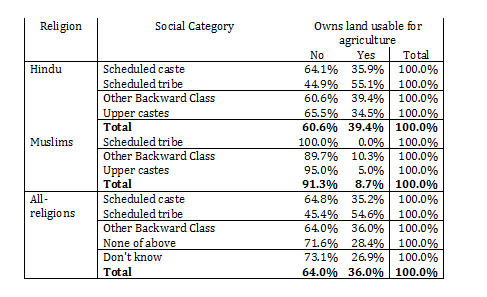
Even in rural areas, a large portion of the Muslim population is engaged in non-agricultural activities. On the whole, around one-tenth of the Muslim population is agriculture-dependent. It is very low when compared to that of all other communities.
The percentage of Households owning agricultural land is less than 15 per cent among the Muslim community. It is far lower than that of any other community in the State. It is noteworthy to observe that a majority of (more than half of them) Muslim population is dependent on the income from daily wages (labour). It is so for Muslim-BCs as well as Muslim-Others.
Table-4: Owned land usable for Agriculture by Religion in Telangana
As regards the household income, first, the given average monthly household income is combined one of rural and urban areas. The average urban income has always been higher than the rural for any SRC. The pointherein is that the rural and urban combined average income of a community that is largely concentrated in urban areas is influenced by their higher urban average.
It is often higher when compared to the other communities which are concentrated in rural areas. The higher average household income of Muslims (rural and urban combined) is largely due to their high urban concentration.
Second, following the previous point, transactions in the urban economy, including the payments for the wages or receipts, are largely in cash form, whereas in rural there is a space for kind transactions. While reporting income, there is scope for under-reporting the kind transactions/receipts/payments than that of those in cash form.
Third, household income depends on the number of earning members as well. The average household size among the Muslim community is higher, and it is even higher among the lower economic strata of the community. The average earning members in the Muslim community are also relatively high.
The apparent advantage of the community reflected in a higher percentage of them having a monthly household income of more than 10,000 will disappear if one considers the monthly per capita household income.
Fourth, lower attendance rate and the high dropout rate among Muslims resulting in engaging their children and youth in economic activities at an early age, indicating a desperate need for their contribution to the household’s subsistence level of income.
Household Expenditure and Poverty conditions
Similarly, the above explanation applies to the situation on average total monthly expenses as well. First, it is rural and urban combined average monthly expenditure.
The combined figure is influenced by the urban average of the highly urban concentrated Muslims. Further, it is the average monthly household expenditure that they pointed out, not the monthly per capita household expenditure, given the fact the average household size of the Muslim community is higher than any other socio-religious community (SRC) and thereby the state average.
However, their higher household expenditure does not reflect a higher per capita expenditure . In this regard, the lower rate of growth in MPCE of Muslims, when compared to other SRCs, persist their economic disadvantage. In fact, the Commission of Inquiry report has shown that the poverty ratio among backward classes (BC-E) among Muslims is higher than Hindu-OBCs. Also, it was found that the risk of poverty is higher among these backward communities.
Table-5: Average MPCE (in Rs.) of Different SRGs
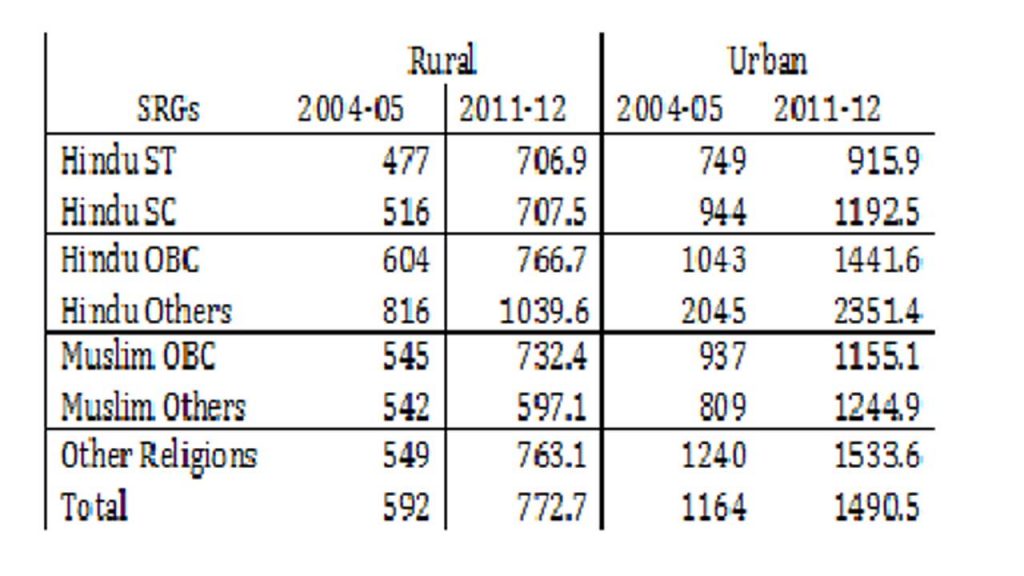
Source: Ravi (2020)
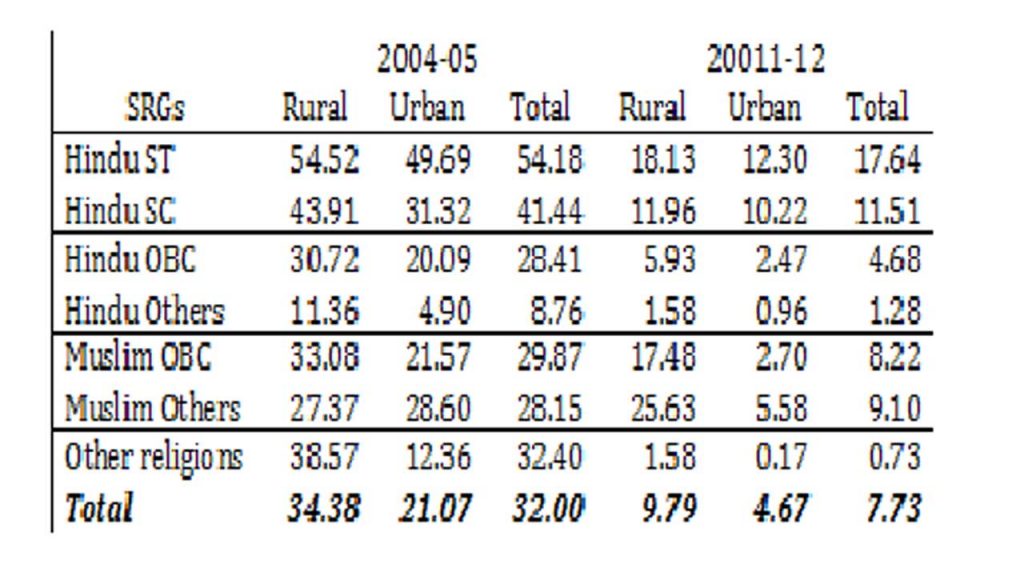
The poverty headcount ratio reflects the low levels of consumption expenditure per capita among Muslim households similar to that of SCs and STs. Around 8.5% of Muslims in Telangana state are living below the poverty line. One could noticethat economic conditions, especially the proportion of Muslim population in rural areas living below the poverty line, is more than SC and on par with the STs (Table-6). Among Muslim-Others 25.63% of population lived in poverty in rural areas of Telangana in 2011-12. Among Muslim-OBCs in the rural area, 17.5% of the population lived below the poverty line.
Table-6: Poverty Head Count Ratios for Rural and Urban Areas
Overall, the economic conditions of the Muslim population in Telangana state are no better than Hindu OBC, SC and ST. Hence, it needs policy intervention towardswelfare measures.
Access to Credit
The percentage of households having any kind of savings is lower among the Muslim community. Among those households having any savings, the percentage of households deposited their savings in banks is lower among this community. The presence of Muslims among the beneficiaries of State-funded secular loans is lower when compared to any other socio-religious community.
The average financial asset value of the Muslim community is lower than that of any other socio-religious community. The average amount of borrowings from credit agencies, particularly from institutional ones such as banks, is lower among the Muslim community; it is lower than that of any other socio-religious community. For the Muslim community, it is less than half of the Hindu community and less than one-third of others.
The percentage of borrowing of the Muslim community on compound interest rate is relatively higher when compared to that of others. The utilisation of loans for consumption purposes is higher for the Muslim community, leaving a meagre amount of loans for investment in any productive purposes. This explains the poor economic conditions of the Muslim community.
The findings of the Commission of Inquiry, Telangana,also reveals that Muslims have lowasset ownership, with more than 34% living in rented houses and only 38% in Pucca houses. The poverty headcount ratio for Muslims living in rural areas is as high as 26%. About 48% of urban Muslim men and 65% of urban Muslim women are self-employed, a higher proportion than any other socio-religious group in the State. The table below indicates that only 27% of Muslims have credit frombanks, much lower than other groups.
Table-7: Socio-Economic Conditions of Muslims in Telangana
| Category | Muslims | Hindus | SCs | STs | Other minorities | |
| 1 | 2 | 3 | 4 | 5 | 6 | 7 |
| 1 | Owned Houses | 66% | 87% | 88% | 88% | 78% |
| 2 | Lived in Pucca house | 38% | 48% | 42% | 44% | 56% |
| 3 | Self-employed in non-agriculture | 16% | 11% | 7% | 8% | 8% |
| 4 | Unemployed but seeking work | 4% | 3% | 3% | 2% | 4% |
| 5 | Poverty Headcount Ratio (Urban) | 3.4% | 1% | 10% | 12% | 0.17% |
| 6 | Poverty Headcount Ratio (Rural) | 19.2% | 2% | 12% | 18% | 1.6% |
| 7 | Households taking loans from banks | 27% | 34% | 21% | 34% | 22% |
New Welfare Measure of Telangana – The Country’s Largest Cash Benefit Scheme
A new Dalit Bandu Yojana has now been announced where the government provides a one-time grant of Rs. 10,00,000/- to Dalits in the State. The main objective is to provide financial security and secure their future. The scheme aims at empowering Dalit families and enabling entrepreneurship among them through a direct benefit transfer. Dalit Bandhu is the country’s largest direct benefit transfer.
The scheme will target 11,900 Dalit families, 100 each from 119 Assembly constituencies in the State, who would be selected for cash assistance of Rs 10 lakh each without any bank collateral to start their venture. An initial outlay of Rs 1,200 crore was sanctioned.
However, Muslims constitute 12.8% of the population of Telangana, numbering nearly 4.8 million in a total population of 38 million. Despite being overwhelmingly urban, the Muslim population is the second poorest, just marginally above the predominantly rural Scheduled Tribes (ST). According to the findings of the Sudhir Commission, about 48% of Muslim households in the State live on an income of less than Rs 10,000 a month.
The inclusion of Muslims in the ongoing Dalit Bandhu scheme can lift a vast majority of the Muslim population from endemic poverty and backwardness. The plan proposed below outlines the increase in outlay if the scheme is extended to the poorest household among the Muslim community.
As per the findings of the Commission of Inquiry, the average size of the Muslim household is 5.5. Hence the number of Muslim households in Telangana is approximated to be around 8.8 lakhs.Centre for Economic and Social Studies (CESS) has estimated that about 8.5% of the Muslim population in Telangana is living below the poverty line.
While accurate data about BPL Muslim population is unavailable, it is safe to assume that 1% of the Muslim population is in abject poverty. Hence, approximately 9000 households are to be considered for the direct benefit transfer scheme.
The State Budget Revenue Expenditure for the year 2021-22 is around Rs. 1.7 lakh Crores. If each household is allocated a sum of Rs 10 lakh, the burden on the Government of Telangana will amount to Rs. 900 Crores.
The direct cash transfer to Poor Muslim households as a percentage of the State Budget Revenue would be around 0.53%. Meanwhile, the Ministry of Minority Welfare in the State has been allocated Rs 1600 crore in the FY 2020-21.
Table-8: Estimates for Economic Assistance through Direct Cash Transfers Uplifting Muslim Poor in Telangana
| Sno | Details | Value |
| 1 | Total Population of Telangana for the year 2021 (as per the Census of IndiaProjection ) | 3.8 Crore |
| 2 | Percentage of Muslim population in Telangana (as per the SKS 2017) | 12.8% |
| 3 | Muslim Population in Telangana (estimated) for the year 2021 | 48.3 lakhs |
| 4 | The Average Household Size of Muslims Families in Telangana (as per the COI-CGG Survey in 2016) | 5.5 |
| 5 | Number of Households (estimated) for the year 2021 | 8.8 lakhs |
| 6 | Percentage of Population Below Poverty Line (BPL) in 2011-12 (as estimated by CESS) | 8.5% |
| 7 | Estimated Number of Poorest Households among Muslims which would be the targeted Beneficiaries @1% of its population (There is no recent estimate for the poverty ratio, but there is a strong reason to assume that still there is below 5% of the Muslim population in the State living below the poverty line. Therefore, one may consider at least 1% of the Muslim population for the direct cash transfer (DBT) for the chronic poor among them) | 9000 HHs |
| 8 | Amount of Benefit for each beneficiary Muslim Household | Rs. 10 lakh |
| 9 | Estimated amount of Direct Cash Transfer to Poor Muslim Household that it will cost to the Public Exchequer – Government of Telangana | Rs. 900 Crores |
| 10 | The total estimated Expenditure (Revenue and Capital) of Telangana State Budget for the year 2021-22 | Rs. 2.31 lakh crores |
| 11 | Estimated amount of direct cash transfer to Poor Muslim households as a percentage of the State Budget Expenditure (Revenue and Capital) 2021-22 | 0.4% |
| 12 | State Budget Revenue Expenditure for the year 2021-22 | Rs. 1.7 lakh crores |
| 13 | Estimated amount of direct cash transfer to Poor Muslim households as a percentage of the State Budget Revenue Expenditure 2021-22 | 0.53% |
| 14 | State Budget Allocations in 2021-22 to Minority Welfare Department | Rs. 1606 Crores |
The redistribution can be done in a phased manner over a 3-year period, implying an allocation of only 0.17% of the state budget towards direct transfers aimed at the poorest Muslim households. The financial resources can also be gained from the unutilised minority welfare budgets of the previous years.
Furthermore, the scheme can also be expanded to include 30000 households, thus benefitting all poverty inflicted Muslim, Hindu and Dalit households in the state.
In a vibrant democracy such as India, the state interventions can ensure that the marginalised are not relegated to a second-class existence. At the brink of demographic dividend, the policy discourse must look towards ideas of inclusion and equity. Muslims remain backward and vulnerable due to their inability to avail Government benefits and easy credit. Government action must remedy the disadvantaged groups without politicising it and giving it communal overtones. Moreover, cooperation and support from civil society, NGOs and individuals is an imperative requirement.
Keep this findings AIMIM Chief and Hyderabad MP Asaduddin owaisi said he will pursue the same the KCR led Telangana Government to extent all possible remedies for the upliftment of Muslims in Telangana.
Now you can get latest stories from Indtoday on Telegram everyday. Click the link to subscribe. Click to follow Indtoday Facebook page and Twitter and on Instagram. For all the latest Hyderabad News updates